Dashboard DESIGN.md for AI Agents
A behavior-first dashboard DESIGN.md for AI agents: define density, navigation, charts, tables, states, and accessibility so operational UI stays coherent.

See it in practice
Related DESIGN.md references
Curated directory entries with practical workflows and visual contracts — not blog posts.
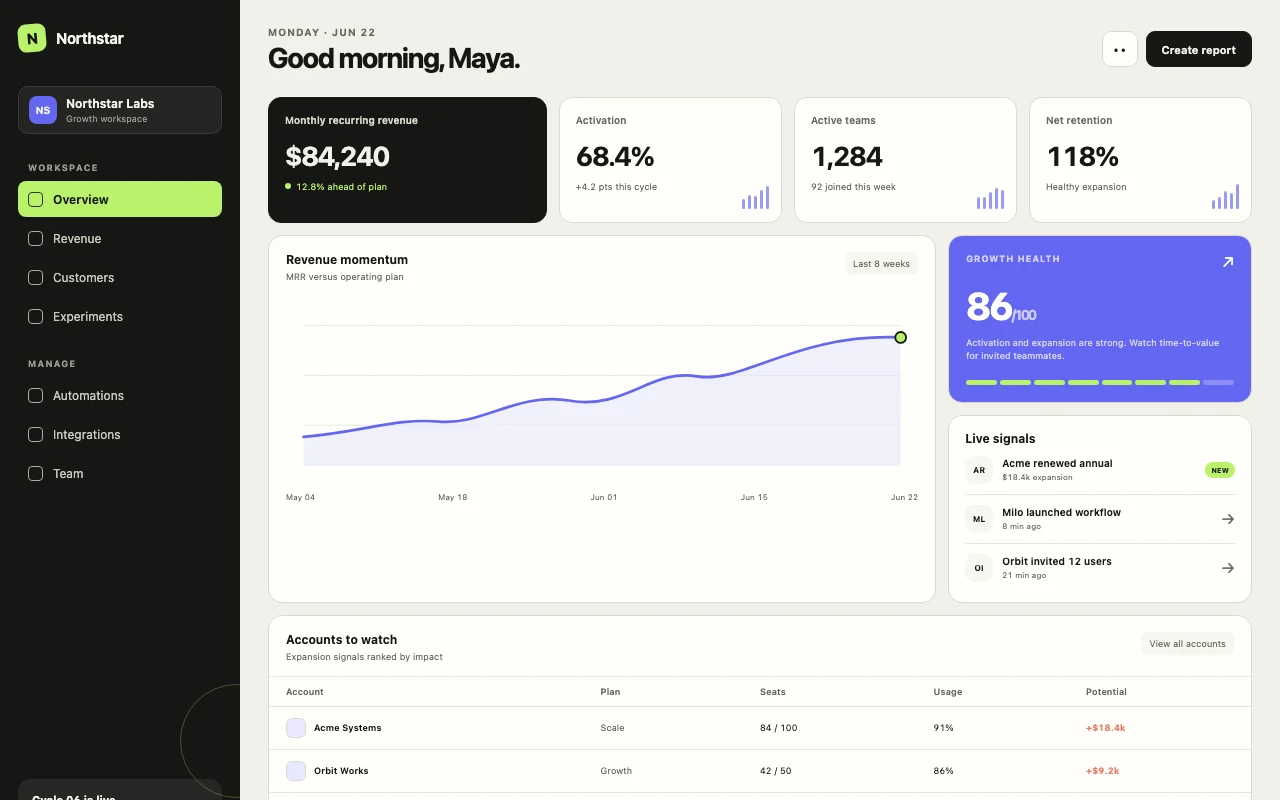
Minimal SaaS Dashboard DESIGN.md
A calm, data-dense dashboard template with strict spacing and semantic tokens.
Open directory reference →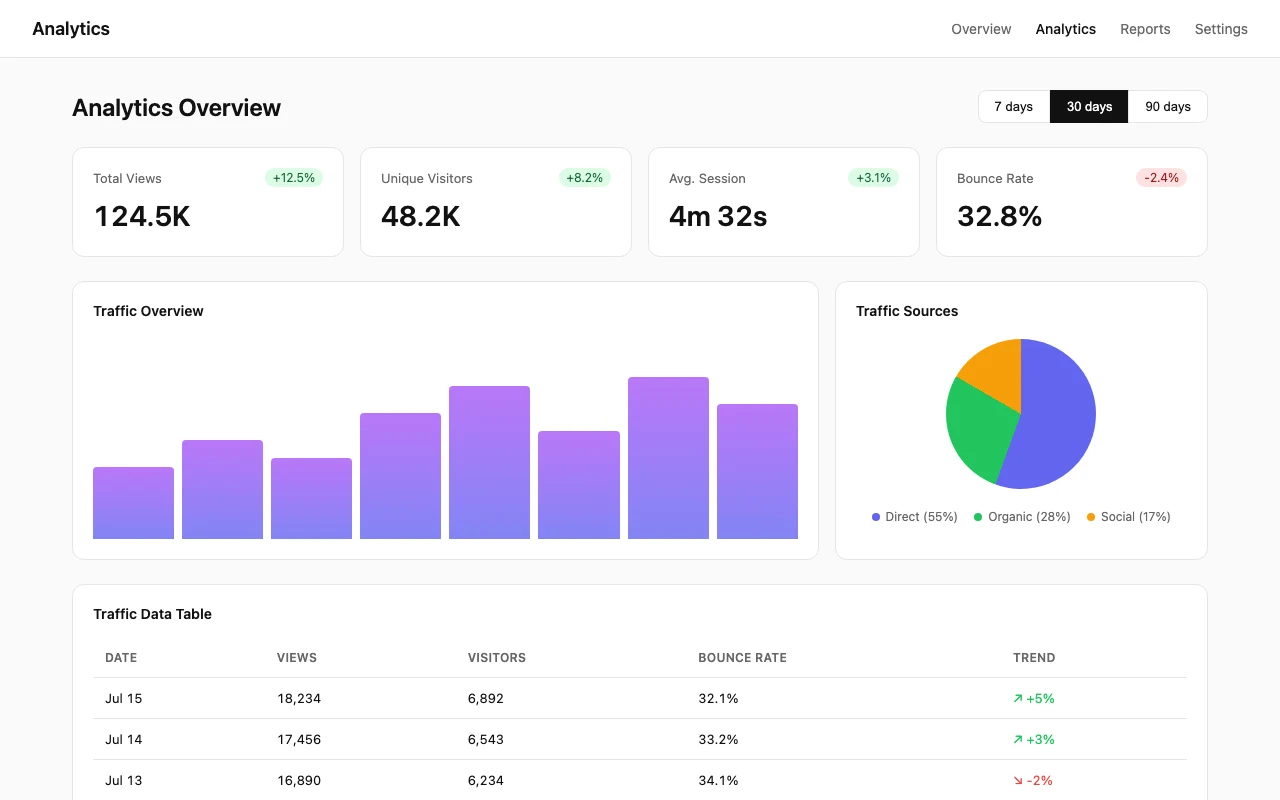
Analytics Dashboard DESIGN.md
A chart-forward dashboard template with clean surfaces and accessible data visualization.
Open directory reference →
Tailwind CSS DESIGN.md
A practical design contract for spacing, color, and component tone with Tailwind.
Open directory reference →The short verdict
A token-only dashboard spec gets you consistent colors and inconsistent behavior. The same agent that applies your hex codes faithfully will still build tables with awkward density, charts without empty states, and responsive layouts that collapse at the wrong breakpoints. The fix is not more tokens — it is a behavior contract that specifies what the interface does, not just what it looks like.
This article is a practical guide to writing that contract. It covers density and hierarchy, navigation and responsive collapse, tables and charts with their loading and error states, semantic tokens, and the anti-patterns that turn a useful dashboard into a polished but unusable demo. The examples are starting points; adapt the values to your domain, viewport constraints, and accessibility requirements.
Where the contract earns its keep
The contract earns its keep wherever a token cannot answer a user-behavior question. It should tell an agent what a user scans first, how a table behaves when columns compete for space, where filters move on a narrow viewport, and what appears when data is loading, empty, or unavailable.
These are product decisions, not universal dashboard laws. A dense operations tool may need compact rows and persistent filters; an analytics product may prioritize chart legibility and progressive disclosure. The DESIGN.md should name the choice and the reason, so the agent can extend the system without inventing a new default for every route.
Density and hierarchy
Dashboards are for scanning, not reading. The DESIGN.md should specify what a user sees first, second, and third when the page loads. This is not about font size alone — it is about information priority. A KPI strip sits above a table; a filter bar sits above both or beside them depending on viewport width; a sidebar holds secondary navigation that should not compete with the main content.
Density rules are equally important. The values below are examples — adapt them to your data density and viewport constraints. A compact SaaS dashboard might use 4px for icon-text pairs, 8px inside cards, 16px between form fields, 24px between sections, and 48px above page titles. An analytics dashboard with sparse data might double those values. State your target explicitly: "aim for 8–10 data points above the fold at 1440px" or whatever fits your domain.
- Specify scanning order: what is primary, secondary, tertiary on page load.
- Define spacing values as examples, not universal standards — adapt to your density needs.
- State target density: data points per viewport, not just "comfortable spacing."
- List what should never compete for attention (e.g., "sidebar nav stays muted; never use accent colors for navigation icons").
Tables, charts, filters, pagination
Data surfaces need explicit rules. For tables: specify default column widths, truncation behavior, hover states, selection patterns, and what actions appear inline versus in a row dropdown. For charts: define the color palette for data series, how many series can appear before switching to a legend, and the empty state when there is no data.
Accessibility is critical for charts and data surfaces. Do not encode meaning by color alone — use patterns, labels, or dual encoding. Define keyboard navigation: how does focus move between table rows, chart segments, and filter controls? Preserve readable contrast ratios (WCAG AA minimum) and define reduced-motion behavior where transitions are used.
- Table: default density, hover behavior, inline actions vs dropdown, empty row state, keyboard navigation for rows.
- Charts: semantic color roles (not color-only encoding), maximum series before aggregation, empty and loading states, reduced-motion alternative.
- Filters: placement, combination logic, clear-all interaction, mobile adaptation, focus management.
- Pagination: default page size (e.g., 25, 50, 100 as examples), control placement, when infinite scroll is acceptable (rarely).
Semantic tokens
Colors mean things in a dashboard. Success is green, warning is amber, danger is red, info is blue — but more importantly, these colors should be mapped to semantic tokens that describe the state, not just the hue. An agent needs to know that "--color-success" is for confirming actions and positive trends, not just that it is green.
Go further: define tokens for emphasis levels (primary action, secondary action, tertiary action, disabled) and surface hierarchy (page background, card background, elevated card, overlay). The more specific the token mapping, the less likely an agent is to introduce a new color that clashes with the system.
## Color tokens (semantic)

- --color-success: confirming actions, positive trends (green family)
- --color-warning: attention needed, neutral alerts (amber family)
- --color-danger: destructive actions, critical errors (red family)
- --color-info: neutral information, non-urgent updates (blue family)
- --color-accent: primary brand color, limited to one CTA per view

Never use raw hex values. Always reference a semantic token.
Empty, error, and loading states
These states are where generic dashboards fail most visibly. The DESIGN.md should specify exactly what appears when there is no data, when data failed to load, and when data is loading. A good empty state is not just an icon — it is a clear explanation plus a next action. "No results" is weak; "No results for the selected filters. Clear filters or adjust your search" is strong.
Loading states need rules too: skeleton vs spinner, how many skeleton rows to show (e.g., 10 for tables as a starting point), whether charts show a placeholder or a loading spinner. Error states should specify tone (calm, not alarming), what information to expose (status code vs human message), and what recovery action to offer (retry, go back, contact support).
What not to copy
A polished marketing dashboard can look impressive while failing as an operational tool. Consider the difference: a marketing dashboard might use large hero sections with decorative gradients, sparse data cards with generous whitespace, and animated entrances that impress on a demo. An operational dashboard needs dense information, minimal decoration, and immediate access to actions.
The linked Minimal SaaS Dashboard and Analytics Dashboard templates show operational patterns: data-dense layouts, muted surfaces, and clear next actions. A marketing dashboard pattern — large typography, gradient backgrounds, decorative imagery — looks professional in a screenshot but pushes critical data below the fold and slows down power users. Your DESIGN.md should specify which pattern fits your use case, or agents will default to the more visually striking option.
Anti-patterns to forbid
The anti-patterns section is where a DESIGN.md becomes a contract. List the things that should never appear, with enough context that an agent understands why. This prevents the "but it looks good" regression.
Common dashboard anti-patterns include: marketing-style hero sections that push data below the fold, decorative gradients behind charts that reduce readability, arbitrary card grids that fragment scanning flow, icon-only buttons without tooltips, and empty states with no next action. Be specific: "Do not use gradient backgrounds" is weaker than "Do not use gradient backgrounds behind data surfaces; solid surfaces only."
- No marketing hero sections in operational dashboards — data first, decoration never.
- No decorative gradients behind charts or tables — they reduce readability.
- No arbitrary card grids without clear information hierarchy.
- No icon-only buttons without tooltips or labels.
- No empty states without a clear next action or explanation.
- No raw hex values — always reference semantic tokens.
A compact checklist
Use this as a starting point for your own dashboard DESIGN.md. Check off each section as you specify it, and treat the file as living code — update it when the product changes, and review it when the agent output drifts. For detailed setup instructions, see the linked DESIGN.md template guide.
- Density and hierarchy: spacing scale (adapt values to your domain), scanning order, target data density.
- Navigation and responsive collapse: sidebar behavior, breakpoint examples, mobile adaptation.
- Tables: row density, hover states, inline actions, empty rows, keyboard navigation.
- Charts: color series rules with non-color encoding, maximum series, empty/loading states, reduced-motion alternative.
- Filters: placement, combination logic, clear-all interaction, focus management.
- Pagination: default page size (e.g., 25/50/100 as examples), control placement, infinite scroll rules.
- Semantic tokens: success, warning, danger, info, accent, emphasis levels, surface hierarchy.
- Empty states: explanation + next action for every data surface.
- Error states: tone, information exposure, recovery action.
- Loading states: skeleton vs spinner, row counts (e.g., 10 as starting point), chart placeholders.
- Accessibility: contrast ratios, keyboard/focus behavior, reduced-motion support, no color-only meaning.
- Anti-patterns: explicit list of forbidden patterns with reasoning.
Frequently asked questions
Do I need separate DESIGN.md files for different dashboards?
Usually one dashboard section in a single DESIGN.md is enough. Only split if the dashboards serve completely different user types with different density and hierarchy needs.
How specific should spacing values be?
Give exact pixel or rem values (e.g., 16px, 1rem) and the context where each is used. Agents cannot interpret "comfortable" consistently.
What if my product has both marketing pages and dashboards?
Use sections in one file, or split into DESIGN.md (marketing) and DASHBOARD.md (operational). The key is that the agent loads the right contract for the work at hand.
Have a DESIGN.md worth sharing?
Submit your DESIGN.md to the directory and help other makers give their coding agents better taste.
Share your DESIGN.md →